1. General Features
Introduction
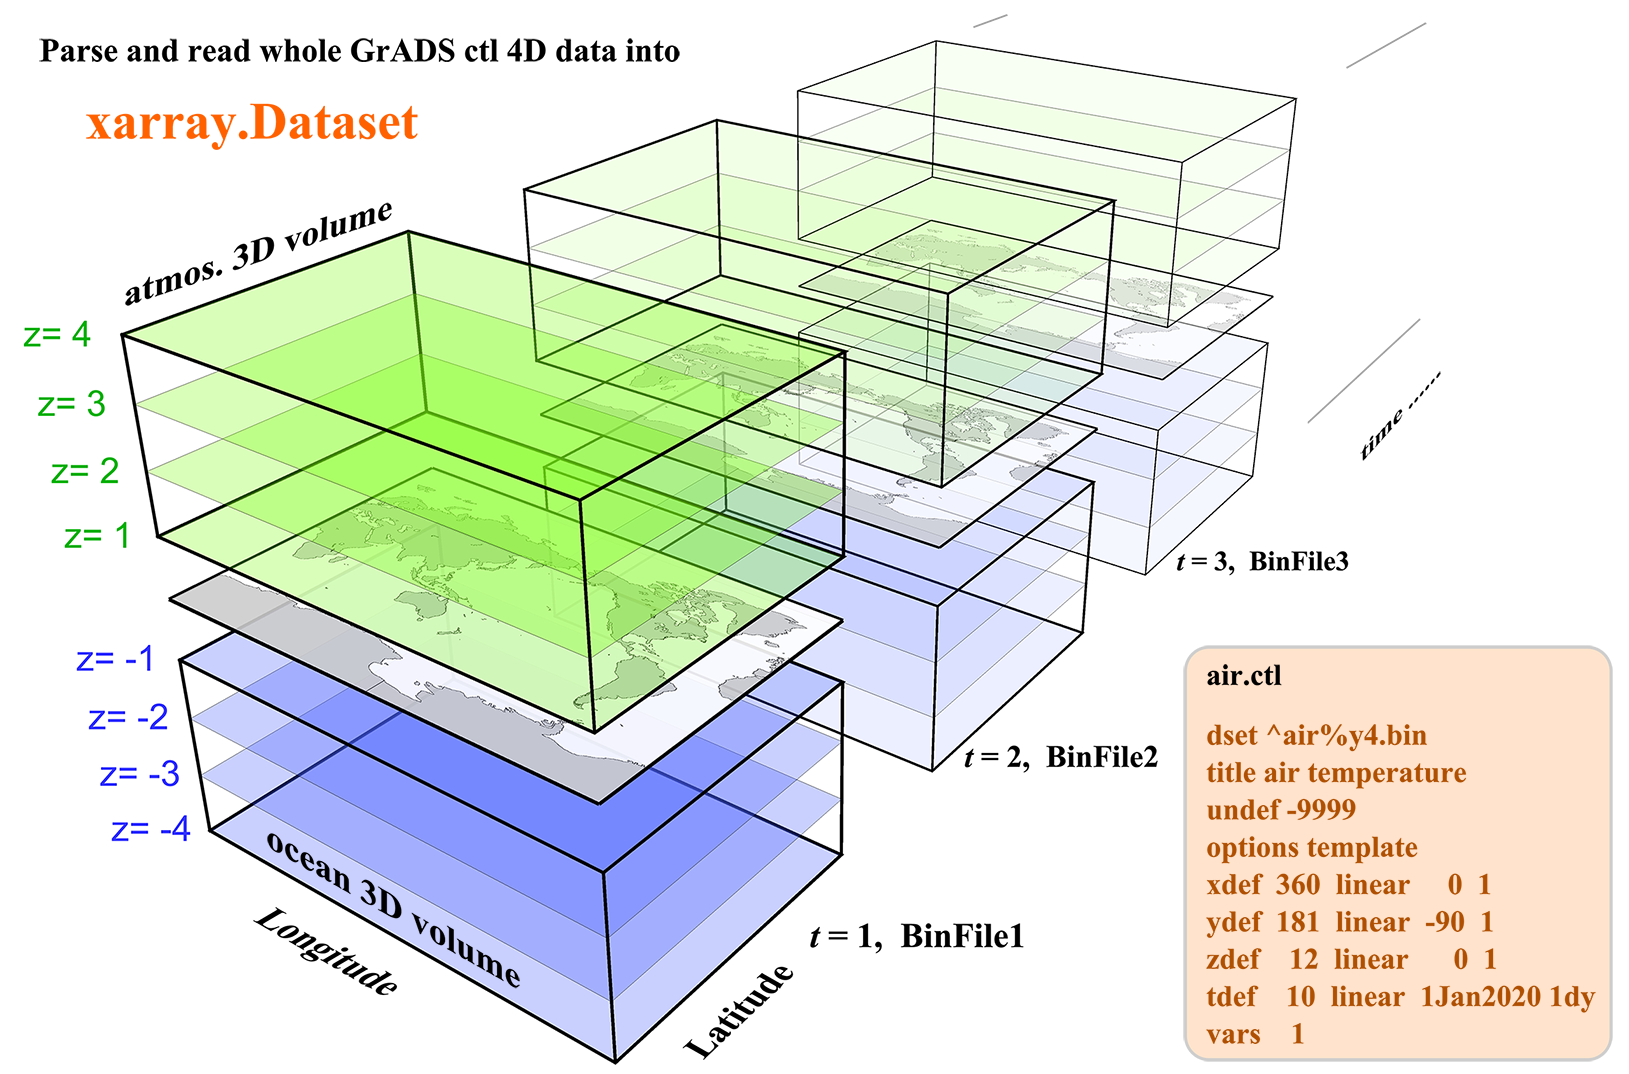
The Grid Analysis and Display System (GrADS or its open-source version OpenGrADS) is a widely used software for easy access, manipulation, and visualization of earth science data. Its targeted users are mainly meteorological scientists (but not limited). It uses a descriptor (or control) file with a suffix .ctl to describe a raw binary 4D dataset. The ctl file is similar to the header information of a NetCDF file, containing all the information about dimensions, attributes, and variables except for the variable data.
This python package xgrads is designed for parse and read the .ctl file commonly used by GrADS. Right now it can parse various kinds of .ctl files. However, only the commonly used raw binary 4D datasets can be read using dask and return as a xarray.Dataset Other types of binary data, like dtype is station, may be supported in the future.
Features
Fast and efficient
GrADS is written using C program language so that it is fast and efficient. In batch mode, GrADS can generate tens of plots in one second. This is really amazing when compared to its counterparts like Matlab and Python-matplotlib.
This xgrads package also utilized the functionalities of xarray, basically the underlying numpy and matplotlib, to support fast and efficient data access and plotting. When data loading and ploting only need 2 lines of codes, you have been in the games!
Automatic map plotting
GrADS is good at dealing with geographic data defined on a latitude/longtiude grid. Its xdef and ydef keywords in .ctl file commonly refer to longitude and latitude. As a result, the map will be plotted automatically when some horizontal data are displayed. One have to explicitly turn off the map drawing using the command set mapdraw off. So if your data are defined on Cartesian coordinates, it still show you the map under the plot. This is handy compared to other softwares when dealing with lat/lon data. For example, when you use Matlab or Python-matplotlib to plot the lat/lon data, you need a lot of extra scripts to add a map (see m_map and cartopy). However, automatic map plotting is sometimes annoying when you deal with non-lat/lon (e.g., Cartesian coordinates) data.
This is still not easy with xgrads as it is only an I/O package now. Plots with map requires the extra package cartopy.
Zonal periodicity
This is amazing feature when your data cover the whole latitude bands. If you want to display from 0 to 400E, GrADS will automatically reuse the data from 0 to 40E as 360E to 400E so that the whole plot is seamless from 0 to 400E. Similarly, you can set the longitude range within -360E to 0, or even unbounded. GrADS will automatically adjust the range for display. However, this is really some kind of disaster when you use cartopy for map plotting, especially labelling in units of E or W (maybe I’m not so good at this). But cartopy is still evolving.